
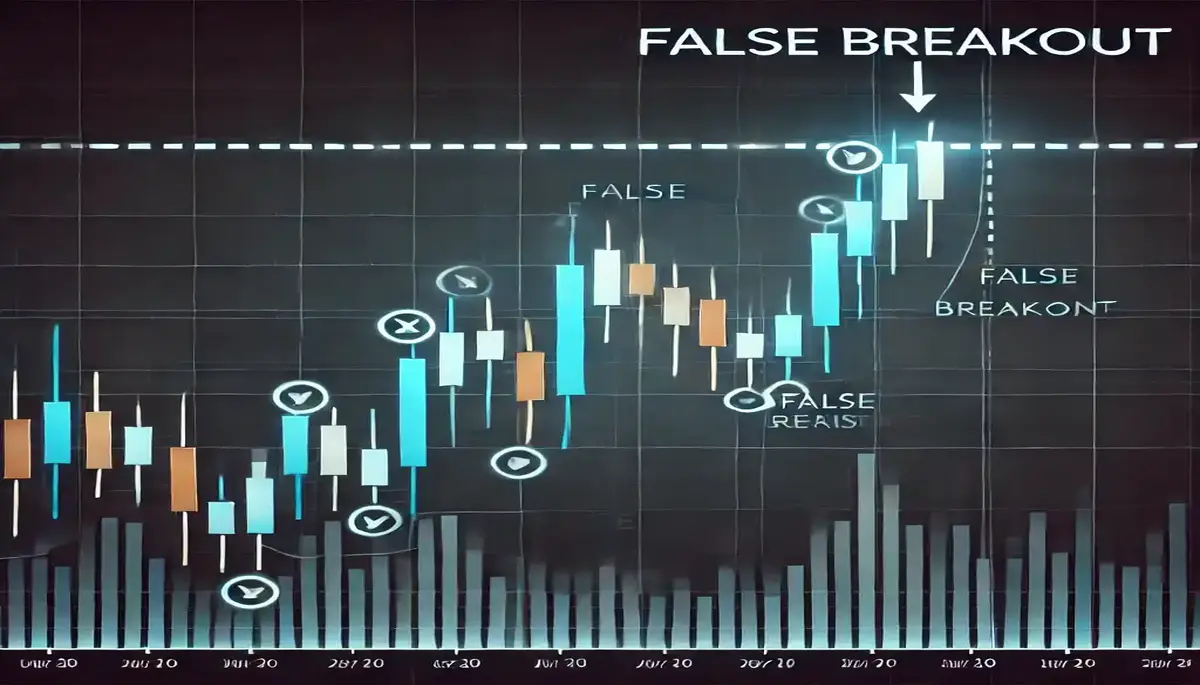
“A financial trading chart depicting a false breakout, with price moving beyond resistance and then returning below, illustrating common market behavior in technical analysis.”
“A financial trading chart depicting a false breakout, with price moving beyond resistance and then returning below, illustrating common market behavior in technical analysis.”